Demographics and Education Before You Relocate


Demographics and education metrics show who lives in a place and what formal schooling adults have finished. A single college percentage is not a quality score until age, race and ethnicity, and attainment tiers are read together. Two towns can print the same graduate share and still need different schools, different childcare, and different clinics, because the people behind that share are not the same age.
Table of Contents
- Demographics and Education for Relocation Decisions
- What Educational Attainment Actually Measures
- How to Read Age and Education Together
- When a College Share Misleads Movers
- City Examples of Demographics and Schools
- Compare Places with ReloMaps Then Shortlist
- Frequently Asked Questions
Demographics and Education for Relocation Decisions
A bachelor's share tells you how many adults finished a degree. It does not tell you whether the block is full of school-age children or retirees. National change is the baseline you compare a city against, not the comparison itself.
The 2020 Census demographic profile counted 73.1 million people under age 18, 22.1% of the population, down 1.4% from 74.2 million in 2010. Adults reached 258.3 million, or 77.9% of the country, after growing 10.1% during the decade. The country got older in the aggregate while some groups stayed young.
Age is not one national number
Median age was 30.0 for Hispanic or Latino residents and 41.1 for the non-Hispanic population. The White-alone population had the highest median age among major racial groups, at 43.1 years. The Asian-alone median was 37.0. The multiracial population was the youngest group, with 32.5% under age 18. The Hispanic or Latino population reached 62.1 million in 2020, up 23% from 2010, against 4.3% growth among people who were not Hispanic or Latino.
A younger local age mix raises demand for schools and childcare. An older mix raises demand for healthcare, retirement services, and accessible housing.
Those service loads land on different households even when both cities advertise a similar college rate.
- Schools and childcare: Places with a larger share under 18 fill classrooms and waitlists first.
- Clinics and accessible housing: Places weighted toward older adults spend more of daily life on appointments, ramps, and single-story stock.
- Labor: A younger Hispanic or multiracial age structure changes who is entering work, not only who already holds a degree.
High-school fit is a household question, not a ranking. Choosing schools with Mrs. College Counselor is a practical walkthrough of program fit once you already know the age mix you are moving into. Read the national age shift as context, then ask whether the street you want looks more like the under-18 basket or the adult basket.
What Educational Attainment Actually Measures
Educational attainment is the share of adults who hold a formal qualification at a given level. It is a human-capital snapshot of people who already finished school, not a report card for the district your child would enter.
The climb was long and uneven. In 1910 only 6% of men and 4% of women had completed four years of college, and median schooling of adults age 25 and older moved only from 8.1 to 8.6 years between 1910 and 1940, according to the Census historical and recent attainment series. By the 1950s more than half of young adults finished high school, and median attainment for ages 25 to 29 reached 12 years.
The middle of the century still left a large unfinished group
In 1960, 40% of men age 25 and older had finished high school and 10% had four years of college, while 42% had completed no more than eighth grade. Between 1960 and 1970, median schooling among Black males ages 25 to 29 rose from 10.5 to 12.2 years. That narrowing was real, and it was not the same path for every group.
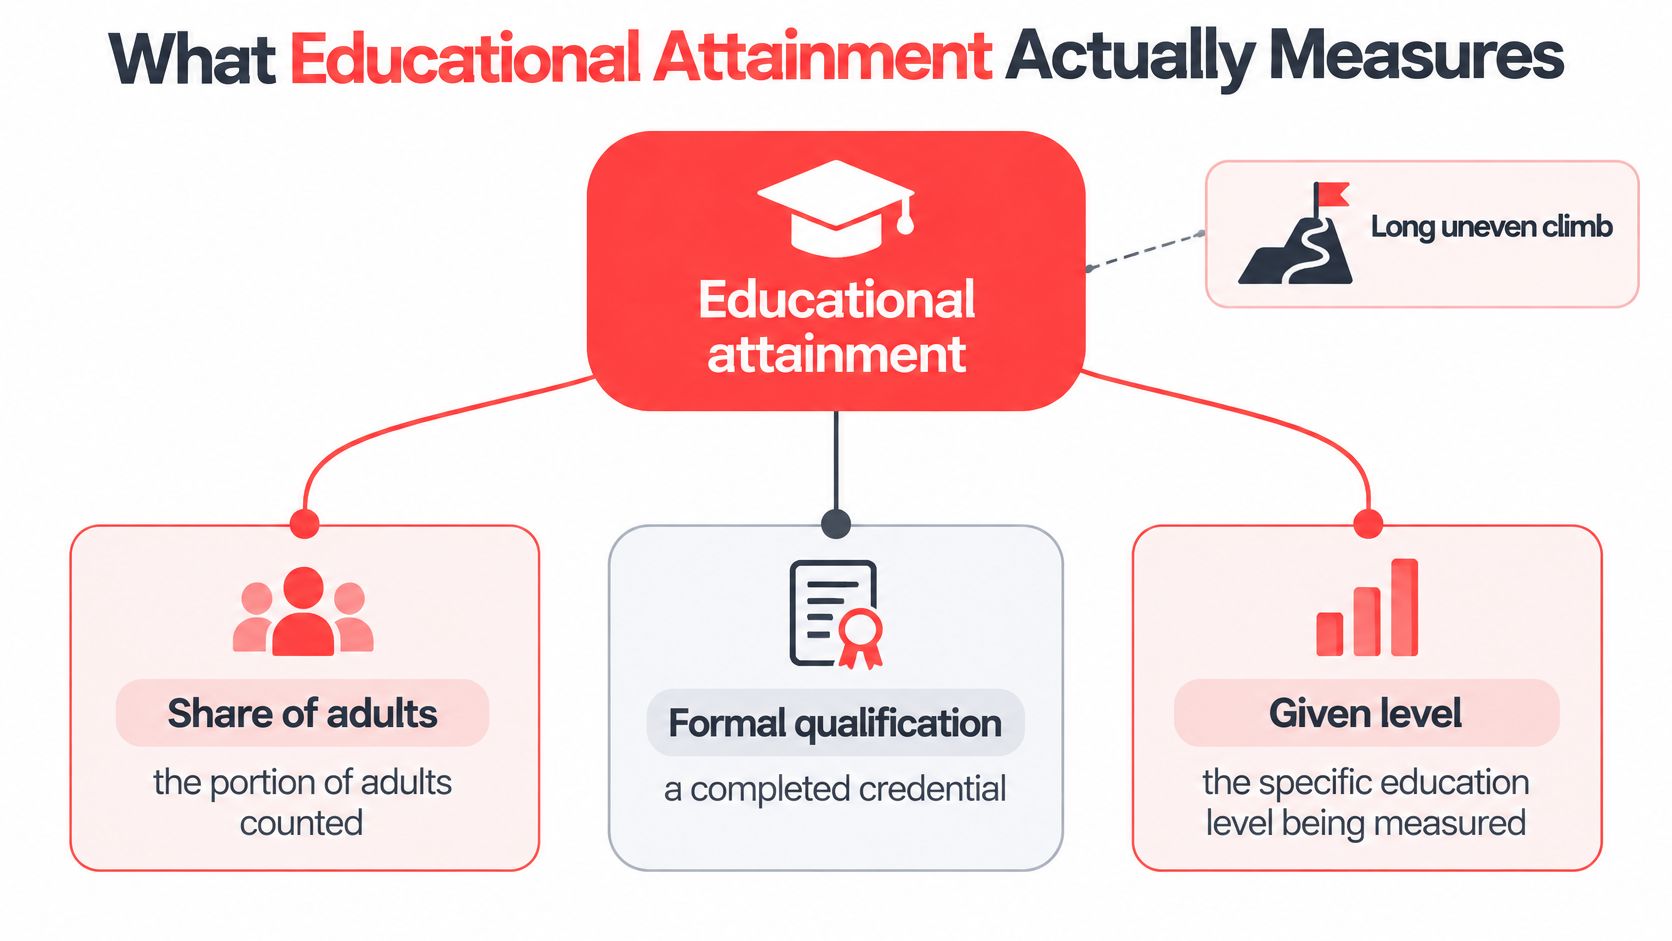
During 2020 to 2024, 35.7% of U.S. adults age 25 and older held a bachelor's degree or higher, and 89.6% had completed high school or more. Among non-Hispanic White adults, bachelor's attainment rose from 33.2% in 2010 to 40.1% in 2019. A city percentage sits on that century. A gap between groups is historical as well as local.
Today's high-school majority would have been an outlier in 1910. Treat a local shortfall as a cohort story before you call the workforce weak.
Reading level still shapes whether a credential turns into daily competence. Choosing books with ReadLab's Lexile guide helps a household match texts to a reader's measured level instead of assuming a diploma equals the same skill everywhere.
Keep three pieces separate when you look at a city page.
- Share of adults: The portion counted, usually ages 25 and older for completed schooling.
- Formal qualification: A finished credential, not years someone started and left.
- Given level: High school, associate, bachelor's, and graduate degrees are different rungs, not one "college" pile.
A single grade that collapses those rungs hides the trades pipeline and the graduate pipeline at the same time.
How to Read Age and Education Together
The same bachelor's label means different labor once you split age and sex. Census educational attainment for 2024 shows 42.8% of adults aged 25 to 39, 41.5% of those aged 40 to 54, and 34.2% of adults aged 55 and older held a bachelor's degree or higher.
| Group | Bachelor's or higher |
|---|---|
| Adults aged 25 to 39 | 42.8% |
| Adults aged 40 to 54 | 41.5% |
| Adults aged 55 and older | 34.2% |
| Women aged 25 and older | 40.1% |
| Men aged 25 and older | 37.1% |
Among adults aged 25 and older, women were at 40.1% and men at 37.1%. Among employed workers, 44.5% reported a bachelor's or higher as their highest attainment, 49.3% a high-school diploma or associate degree, and 6.1% no high-school diploma or equivalent.
An older suburb can look "less educated" and still hold young talent
Picture a subdivision where most homeowners are past 55. The citywide college share drops because that older band sits at 34.2%, even if the smaller 25-to-39 group matches the national young-adult rate. The household that needs peers, night classes, and entry-level professional jobs should read the young band, not the blended average.
A high sub-baccalaureate share among workers is a different signal. Nearly half of employed adults stopped at a high-school diploma or an associate degree. That pattern often marks demand for technical, operational, and skilled-trades labor, not a thin workforce.
Comparison rule: Every city in your shortlist has to use the same age universe and the same attainment tier. Mixing ages 18 to 24 into a "finished schooling" rate pulls in people who are still enrolled and can make a college town look less educated than it is.
Three checks before you trust a headline percentage:
- Age band: 25 to 39, 40 to 54, or 55 and older, kept apart.
- Sex, when the job question needs it: The 40.1% versus 37.1% gap is small nationally and can be wider locally.
- Tier next to employment status: Bachelor's, high school or associate, and no diploma stay separate from whether the person is working.
If you are following young credentialed workers rather than a blended adult average, start from cities suited to young professionals and then split the age bands yourself. A place can be a strong young-adult labor market and a weak match for a household that needs elementary seats.
When a College Share Misleads Movers
A high graduate share is not strong opportunity. It is often a snapshot of adults who already arrived with credentials. Ranking cities by that share hides who can still move up.
Education at a Glance 2025 reports that 19% of adults aged 25 to 64 across OECD countries still lacked an upper-secondary qualification. Only 26% of young adults whose parents did not complete upper secondary school attained a tertiary qualification, compared with 70% when at least one parent had tertiary education.
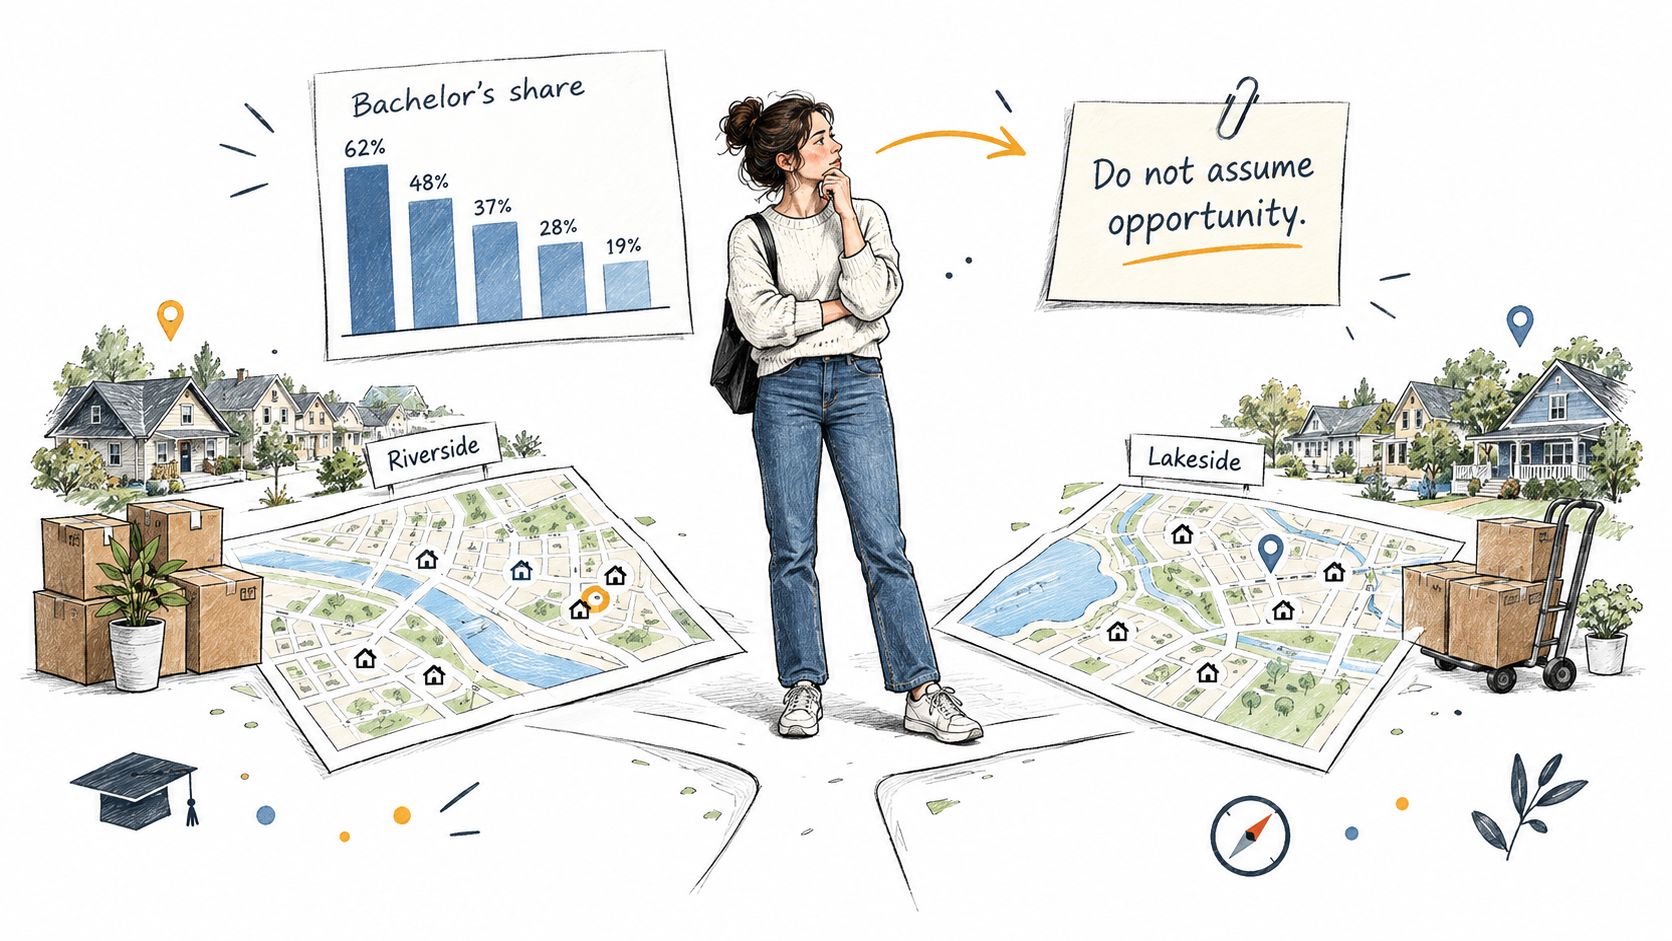
Same city rate, different starting line
Two households can land in one metro with one published college rate. The first has a parent who already finished tertiary education. Across the OECD pattern, that young adult's chance of a tertiary credential is 70%. The second household starts from parents who never finished upper secondary. The comparable figure is 26%. The city did not change. The mobility prospect did.
That gap is why a "highly educated" listing can still be a weak bet for a working-class newcomer. Credentialed adults raise the average without building a ladder for the next family.
Ask which groups can realistically improve their position here, and which institutions make that possible. Read these alongside income, language, and disability, not instead of schools.
- Early childhood: Affordable seats decide whether a parent can work and whether a child enters kindergarten ready.
- Vocational programs and community college: These are the on-ramps when a bachelor's is not the first credential the household can afford.
- Adult learning: A 19% share without upper secondary, measured on ages 25 to 64, is an upskilling problem, not a K-12 ranking.
A talent-pool snapshot answers "who already lives here with a degree." A mobility prospect answers "can our kids and our own unfinished schooling move from here." Do not score a city on the first and call it the second.
City Examples of Demographics and Schools
National school enrollment is a baseline. It does not predict the peer mix or the enrollment pressure inside one district.
In fall 2023, U.S. public-school enrollment was 43.7% White, 29.5% Hispanic, 14.9% Black, 5.6% Asian, 5.1% two or more races, 0.9% American Indian or Alaska Native, and 0.4% Native Hawaiian or other Pacific Islander, per the National Center for Education Statistics. About 49.6 million students were enrolled in public elementary and secondary schools, compared with 49.4 million in fall 2022. The headcount barely moved. Composition still varies by state and district.
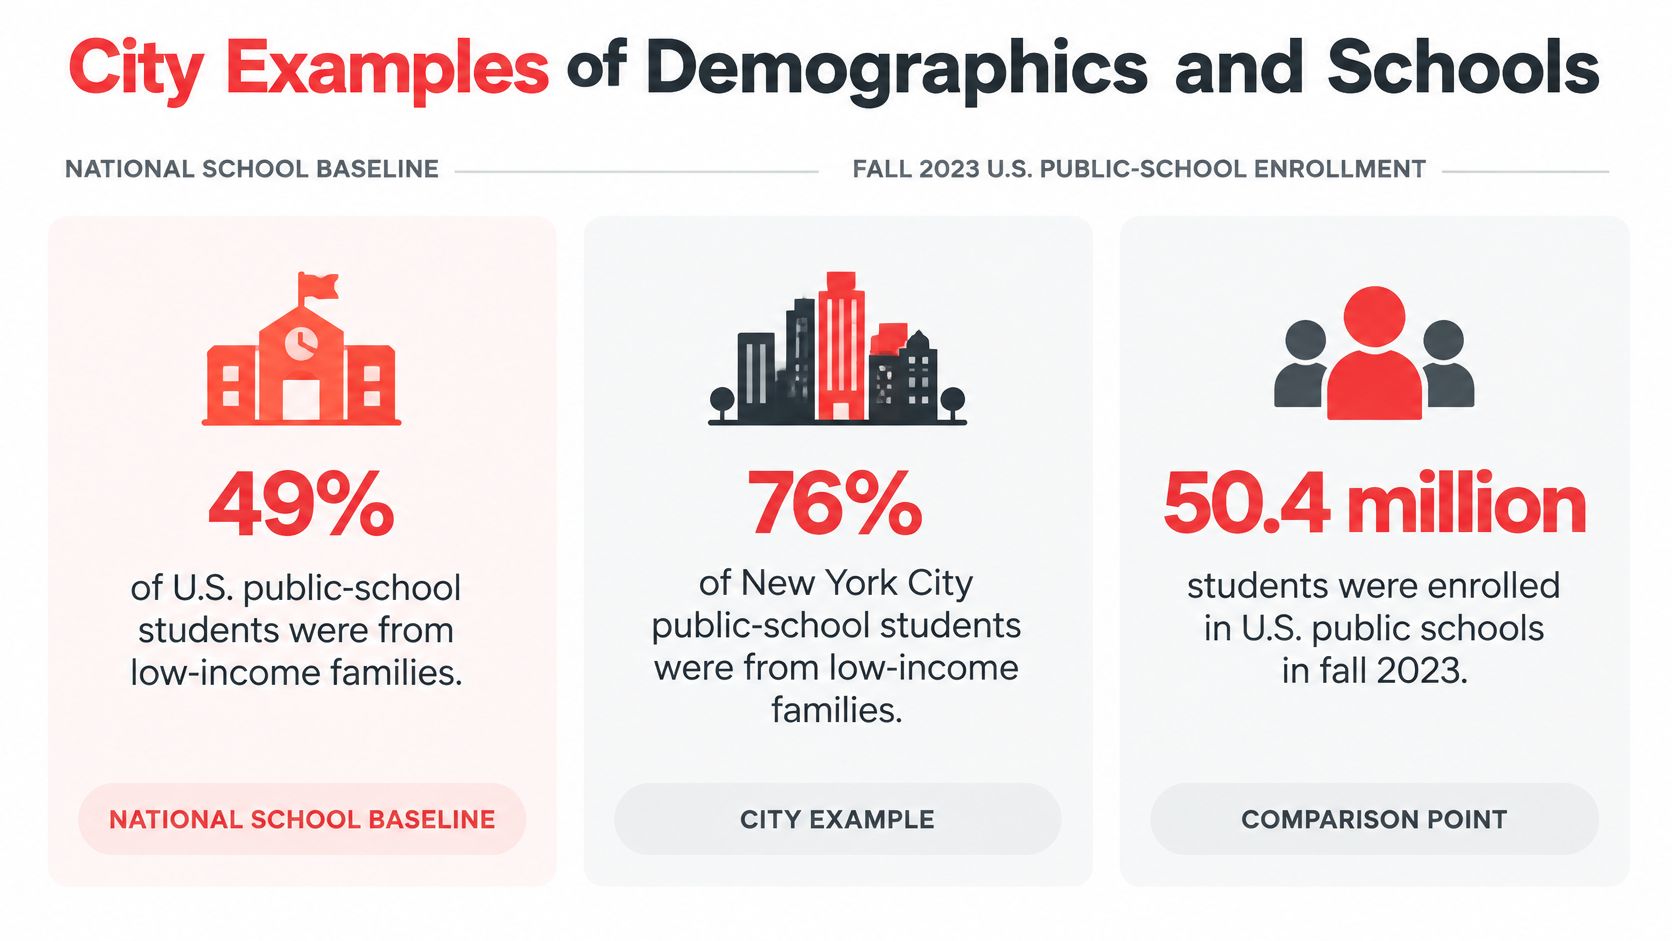
One city against that baseline
Open Austin, Texas when you want a worked example rather than another national average. Set the city's age structure and adult attainment beside the fall 2023 mix, then stop. A metro can be younger than the national adult median and still send children into schools whose peer mix looks nothing like 43.7% White and 29.5% Hispanic. Demographics in Austin are a prompt to leave the national figure, not a substitute for a campus.
Enrollment pressure is the other half. A flat national total, 49.6 million after 49.4 million, can hide a district that is adding kindergarten seats while a neighboring district is closing a wing. Your commute, your after-school drive, and your shot at a preferred campus depend on that local swing.
Peer mix and seat pressure are school and district facts. A city page can tell you the adult and age context around them. It cannot stand in for the enrollment report.
If the household is choosing among smaller places rather than one large metro, scan towns that fit family life and repeat the same three-step habit: national baseline, then the city page, then a reminder that the classroom still needs its own data. Families comparing remote or hybrid options can use school selection advice from Queens Online School to see how program rankings differ from a local peer mix. Neither replaces the district file.
Compare Places with ReloMaps Then Shortlist
Listing sites show the house. They rarely show, in one consistent grade, who lives nearby and what schooling adults have finished. A portal built around listings and agent leads will surface photos, price, and a school name. It usually will not hold education and demographics to the same scale from a small town to a large metro.
ReloMaps puts U.S. cities and towns on a map and a grid, with a ReloScore and category grades from A+ to F. Filters cover economics, demographics, education levels, home values, rents, commute times, work-from-home rates, and homeownership. Quick filters include family-friendly and affordable. Pasting a Zillow or Redfin URL pulls city and neighborhood context for that listing, which is the gap when you have a house you like and no read on the adults around it.

Keep the filters as separate as the statistics
Do not collapse age and attainment into one college grade. Filter education level on its own, then add the household constraint that binds you, such as rent, home value, or work-from-home share. A high education grade next to a long commute is a different daily life from the same grade next to a short one.
Use the map and grid of U.S. places for that pass. Open two or three city pages. Check whether the age mix matches the schools, the childcare, or the healthcare your household will use in the first year, not the amenity list on the listing.
A shortlist that survives this check has three pages, the same age universe on each, and a written note on which service you are buying with the move.
Frequently Asked Questions
Should I compare cities on ages 18 and older or ages 25 and older?
Completed attainment should use ages 25 and older, because many people ages 18 to 24 are still in college, and counting them can make a place look less educated. The 2024 Census detailed tables report both the population age 18 and older and the population age 25 and older, and they split high-school completion, some college without a degree, associate degrees, bachelor's degrees, master's degrees, professional degrees, and doctorates. They also break results out by age, sex, race, Hispanic origin, and nativity. Two city pages are comparable only when both use that same universe and the same rung. If one page mixes in current college students and the other does not, the "less educated" label is an artifact.
What tertiary share should a remote worker treat as a deep professional pool?
Across OECD countries, about 40% of adults aged 25 to 64 hold a tertiary credential, about 40% have upper-secondary or post-secondary non-tertiary education, and 20% have not finished upper secondary, so a local share near that 40% tertiary mark is an ordinary professional pool, not a standout one. OECD attainment comparisons also show that among residents aged 25 to 34, women average 52% tertiary attainment versus 39% for men. A citywide average hides that 13-point cohort gap, and "tertiary" is not the same length or job path in every country. For remote work, pair the tertiary share with the upper-secondary share: a thin tertiary pool plus a large unfinished upper-secondary share is a hiring constraint, not just a lifestyle preference.
Does a computer-science offering mean my child can actually take it?
Course listings are not usable access. In 2025, two-thirds of countries worldwide offered or planned to offer K-12 computer-science education, double the 2019 share, yet African students remained the least able to reach it because many schools lacked electricity, according to the Education Policy Outlook 2025. In the United States, girls, English learners, students with individualized education programs, and students eligible for free or reduced-price meals remain underrepresented in computing. Teacher capacity is the other gate: 81% of U.S. K-12 computer-science teachers said AI should be part of foundational instruction, but fewer than half felt equipped to teach it. Before you treat a district's CS page as a benefit, check electricity and broadband where relevant, devices, a qualified teacher, transportation, disability support, and whether students like yours enroll.
ReloMaps turns demographics and education into map filters and city grades so a household can see age mix, attainment, cost, and work-from-home patterns before falling for a listing photo. Open two or three places, keep the age bands and degree tiers separate, and check whether the schools, childcare, or clinics match the life you will live. Start that shortlist on ReloMaps.